


Yield curve explainer: What it is and what they mean about the economy
Published: 10:49 22 Mar 2022 EDT
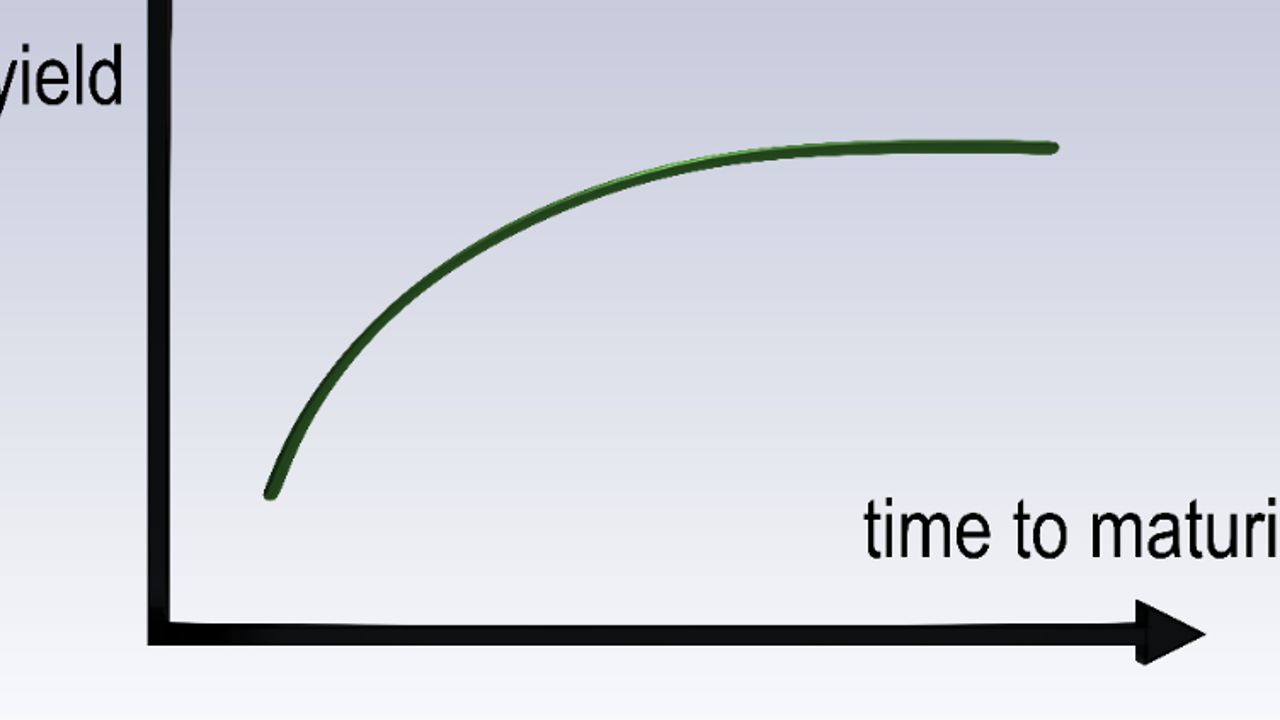
Yield curves plot interest rates (yields) of bonds with equal credit quality against varying maturity dates, with the slope of the curve implying what future rates and economic activity may look like.
These charts, which often compared the yields of 2-year and 10-year government bonds, are widely used as they often can predict changes in the economy.
Yield curve risk comes from the idea that bond prices and interest rates are inversely related, while curve rates are published on the Treasury’s website on trading days.
Three types of yield curve shapes
A normal yield curve - sloping upward
The curve slopes upward in 'normal' conditions as the shorter-dated bonds have a lower yield than longer-dated ones.
When investors are confident about the economy, bonds with longer maturities (expiry dates) have higher yields compared with short-term ones due to reduced risk as time progresses.
If yields are acting in this way they indicate that investors are confident that the economy will expand or improve.
The steeper the curve the larger the expected economic growth in the future, which is often coupled with high inflation and in turn, increased rates.
Inverted yield curve – downward sloping
In this case, short-term bonds are giving better yields than those with long maturities, which occurs during an economic downturn.
As the economy is getting worse, investors prefer safe investments and so tend to purchase longer-dated bonds over short-term ones, bidding up the price of longer bonds driving down their yield.
Flat or humped curve
Bonds with short and long maturities often have very similar yields, which signals economic transition or an uncertain economic situation.
For example, this may occur if the central bank is expected to hike the interest rate.
There can be humps in the middle of the curve with slight variations in yields to the rest.
How to use the yield curve
Investors evaluate it to predict the direction the economy may be headed in to make investment decisions.
For example, if the curve implies a slowdown is coming then people may move money to defensive assets, including consumer staples, that thrive during recessions.
With steep curves, inflation is thought to be on the horizon, so investors would avoid bonds with long maturities as they diminish with rising prices.
Treasury yield curve
The US Treasury yield curve depicts the interest rates of short-term Treasury bills (maturity under a year) to the yields of long-term bonds and notes.
“The chart shows the relationship between the interest rates and the maturities of U.S. Treasury fixed-income securities,” Investopedia commented.